SNL Seasons 1-4 by the Numbers
If you’ve listened to the podcast (and if you haven’t, you should subscribe!), you frequently hear us mention that we assign every single sketch a number grade. While this makes watching each and every episode an involved process (at some point, we will learn the names of our children), it helps us understand where SNL soared and where it sagged.
And now that we are done reviewing the first four seasons - the only ones where the original cast remained mostly intact (goodbye, Chevy, hello, Billy), we can take a look at the numbers and start to see if our data match up with how we felt about each season. So put on your white lab coat, fire up the Bunsen burner, and take a look below at what science has to say about the first four seasons.
The numbering system works like this - we grade each sketch from one (downright offensive) to five (an outright classic.) Most sketches get a three - pretty good, but nothing special. A four means it was really good, but fell short of the all-time pantheon. (The grades take into account both of our opinions, and rarely do we disagree about a sketch’s quality - if we ever differ, it is generally only by a point or so.)
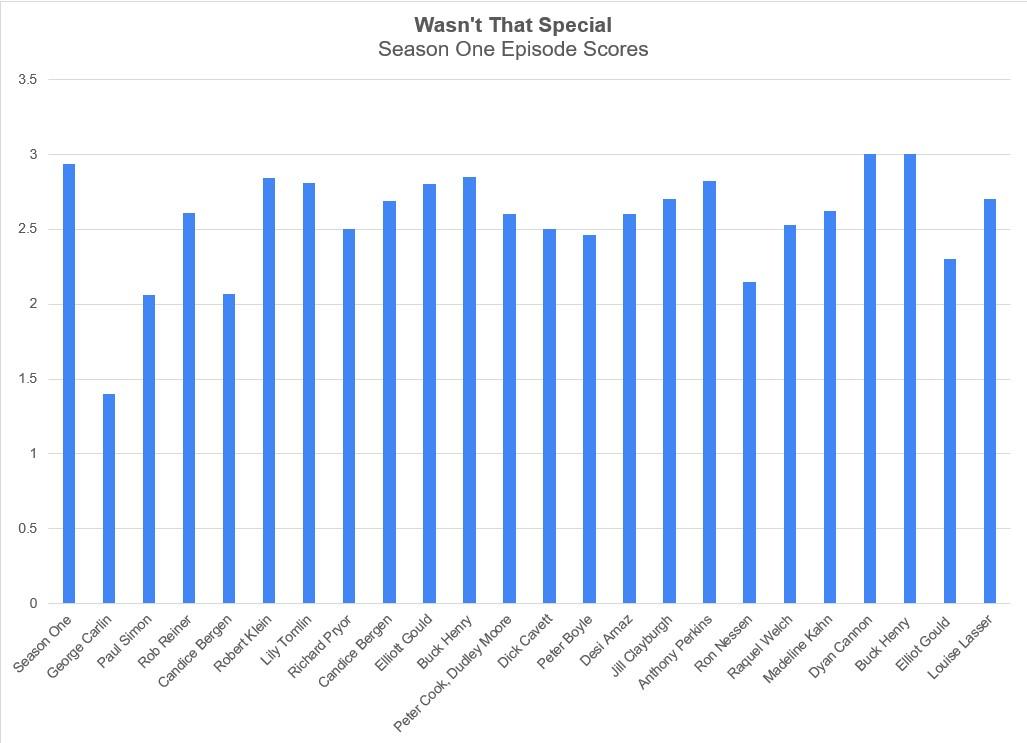
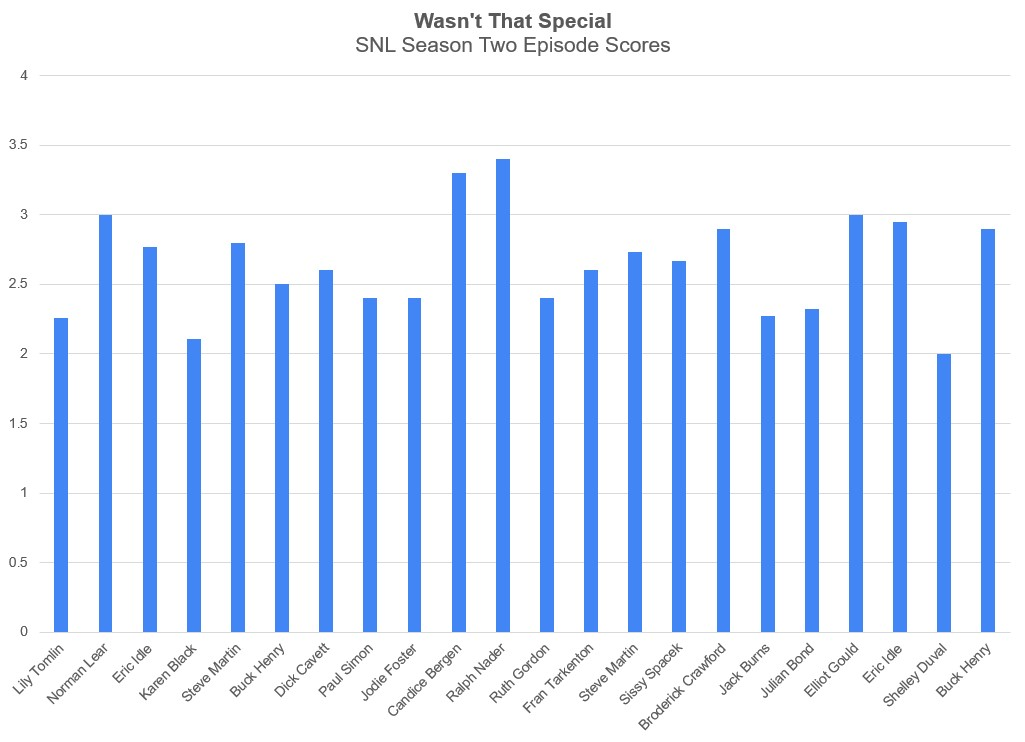
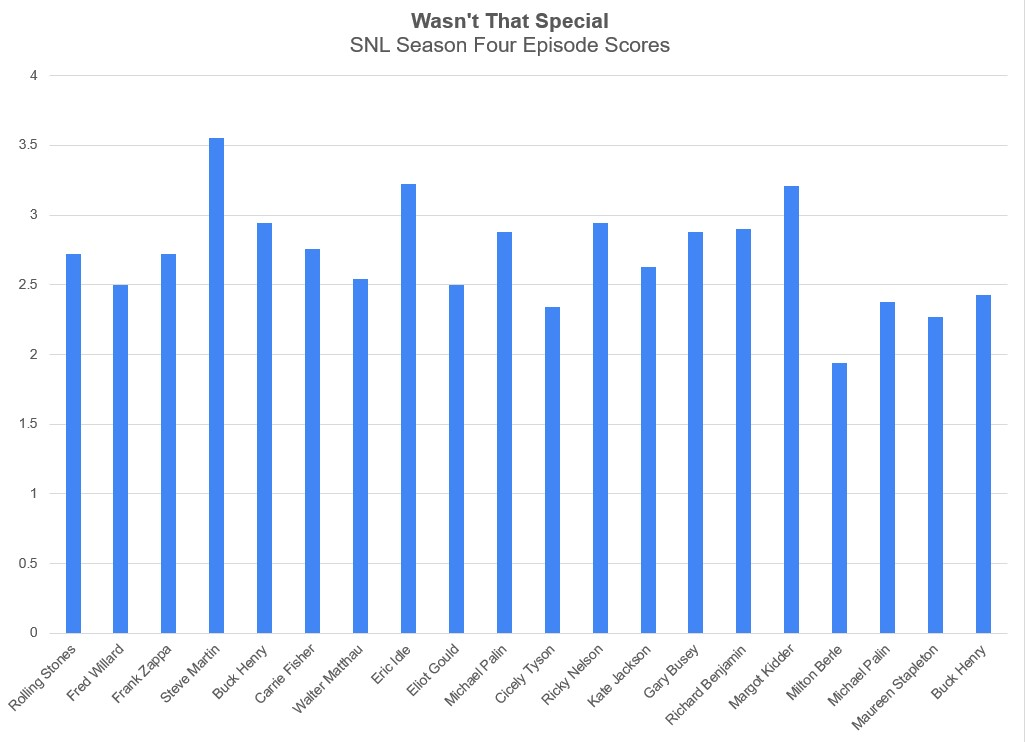
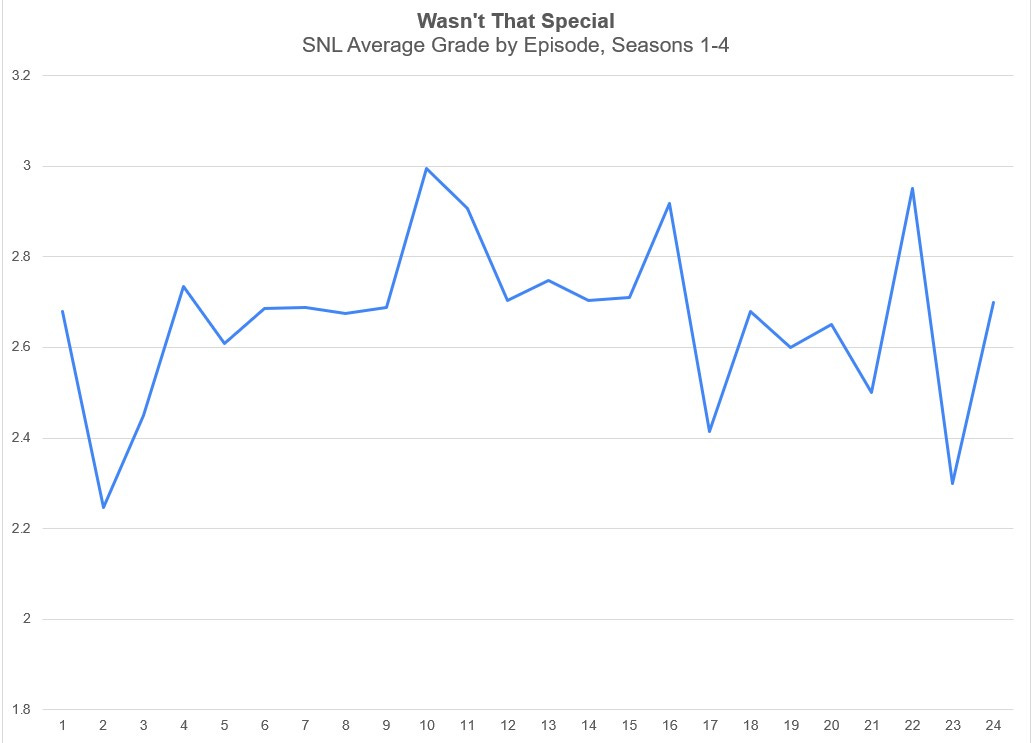
Each season clocks in at roughly 380-400 sketches, so we have a mountain of data to grade each season. Here are four charts detailing where each individual episode in the first four seasons graded out:
It seems that the analytics match up with the eyeball test: On the podcast, we both picked the third Steve Martin episode as the best episode of the first four years, and that is borne out in the data.
And on the most recent show, we both derided the Milton Berle show as the worst episode in SNL’s run to date. Indeed, you can see it is the only episode whose average sketch earned below a grade of 2. (The only exception being the second show in SNL history, the Paul Simon episode, which was essentially just a Simon and Garfunkel reunion show. It doesn’t count.)
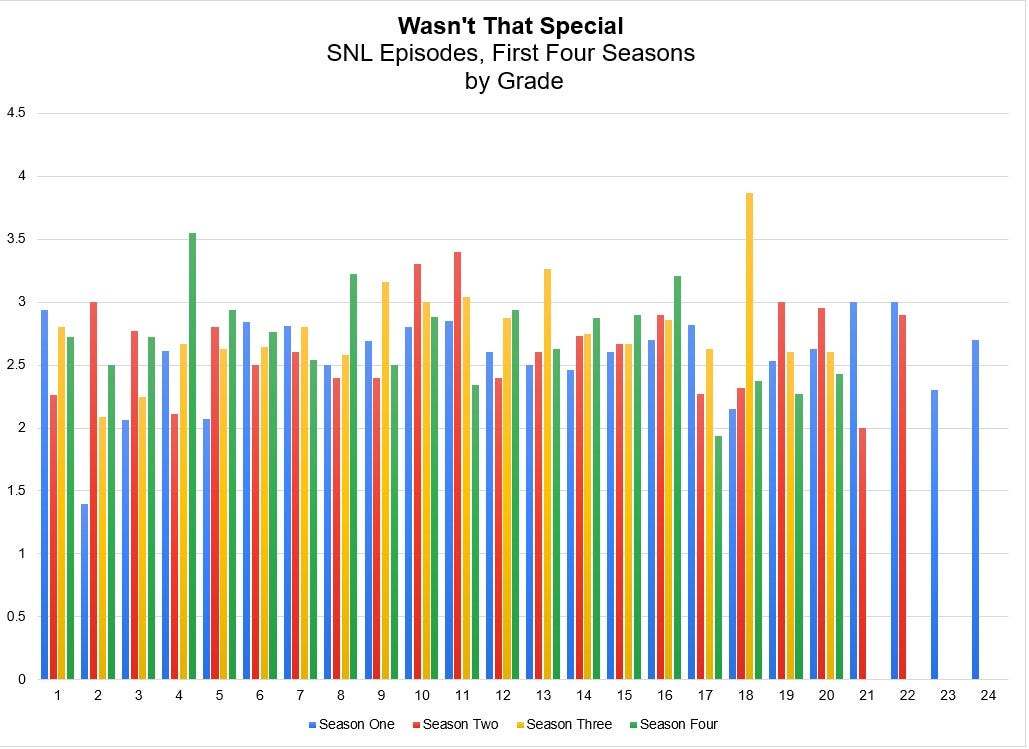
When we combine all the seasons together, we can see if there is a pattern forming:
Or, better yet, we can calculate the average of each week through the first four seasons to see which week is most likely to have a strong episode:
As you can see, the show is most likely to start with an average episode, then throw in a clunker in week two, then stabilize and really hit its stride in weeks 10 and 11, which are the episodes that typically surround the holiday break. Perhaps the cast is particularly excited about taking a break, then anxious yo return a month later. (This break is also when the show brings in new cast members, like Bill Murray, and writers, like Don Novello and Jim Downey.) Then, you’re likely to see one classic episode pop up in the last half of the season before things start to drag. (A note on the above chart: Only Season One had an episode 23 and 24, so those numbers are based on single shows.)
But beyond the trends, the data allow us to calculate which season is, in fact, our favorite. According to the averages of all the sketches, here’s our ranking of seasons:
As you can see, the show got better each season until Season Four, when it took a slight step back. This may simply be a byproduct of Steve Martin hosting only one show in S4 as opposed to three in S3. Similarly, Buck Henry only hosted two shows in S4 and three (counting the Miskel Spillman episode, which was technically hosted by an 81-year old contest winner, but really hosted by Henry) in S3.
The data also allow us to determine the best and worst shows of the first four years. Here are the ten best:
Steve Martin (3.87), Season Three, Episode 18
Steve Martin (3.55), Season Four, Episode 4
Ralph Nader (3.5), Season Two, Episode 11
Candice Bergen (3.3), Season Two, Episode 10
Art Garfunkel (3.26), Season Three, Episode 13
Eric Idle (3.22), Season Four, Episode 8
Margot Kidder (3.21), Season Four, Episode 16
Steve Martin (3.16), Season Three, Episode 9
Chevy Chase (3.04), Season Three, Episode 11
(Tie at 3.0), Buck Henry, S1E21, Elliot Gould, S1E22, Norman Lear, S2E2, Elliot Gould (S2E19), and Robert Klein (S3E10.)
And, of course, the grades also help us pick out the real clunkers in the group. Since it is far more useful to recommend episodes people should watch, here’s just five that you should avoid at all costs:
Paul Simon (1.4), Season One, Episode 2
Milton Berle (1.94), Season Four, Episode 17
Shelley Duval (2.0), Season Two, Episode 21
Rob Reiner (2.06), Season One, Episode 3
Robert Klein (2.07), Season One, Episode 5
As you can see, the overwhelming majority of episodes fall between a grade of two and three. Fourteen episodes graded at three or above, while 72 fell below. Perhaps we are tough graders, but there simply aren’t enough classic sketches to make up for the number of rough ones in the early years. But as you can see, the show is finding its way and trending in the right direction.
So if you want to hear us discuss all these seasons in real-time, please subscribe to the show at whatever level you want. You can join up on a monthly basis, or save money by signing up for a yearly subscription. And, of course, if you join at the Executive Producer level, you get to listen to the podcast and will also receive all the background research we do in putting together the podcast. It’s well worth it.
And watch along with us! Or, if you want, jump on Peacock and start with the classic episodes we’ve listed above.


